The trading journal that reads your charts.
Upload a screenshot from TradingView, MetaTrader or your broker app. The journal fills in symbol, direction, entry, stop, target and R:R, recognises the setup and later the outcome. The statistics then show you which setups really make money.
Free during the launch phase, no payment details. No investment advice.
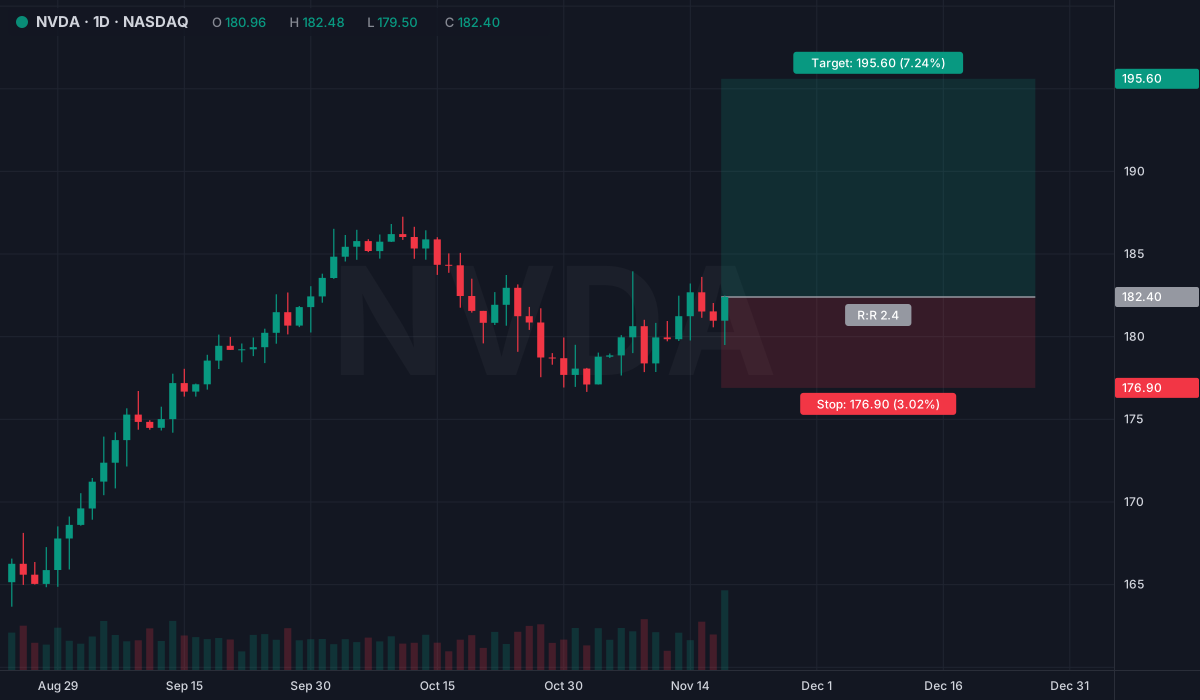
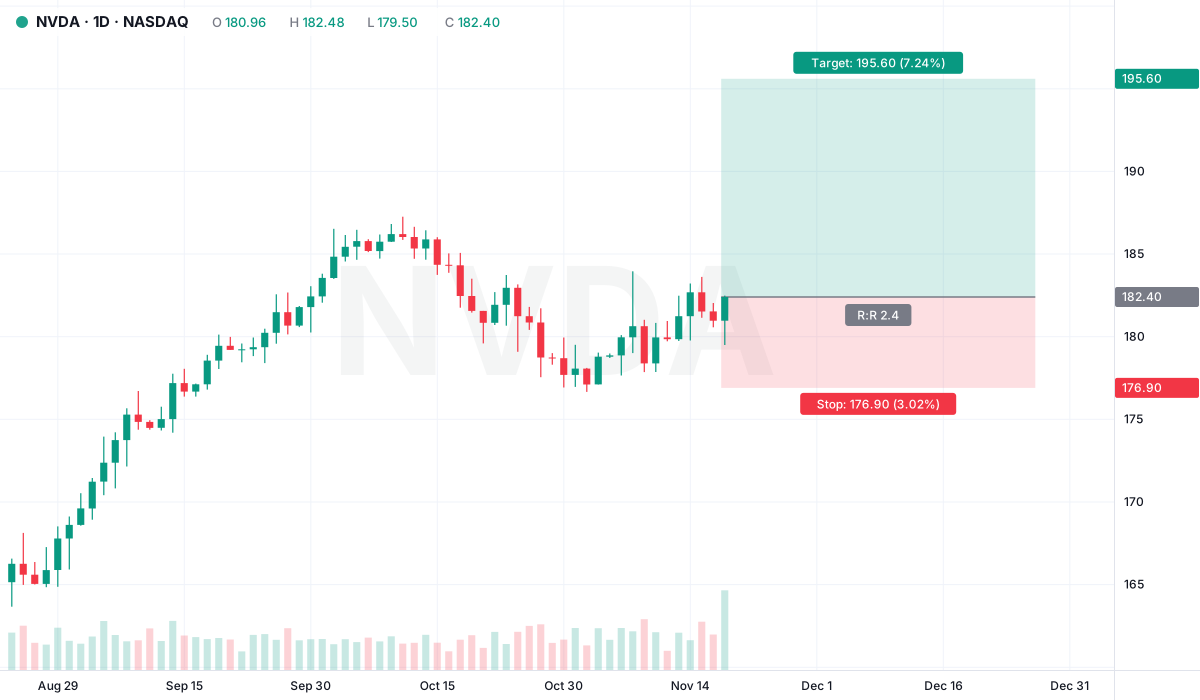
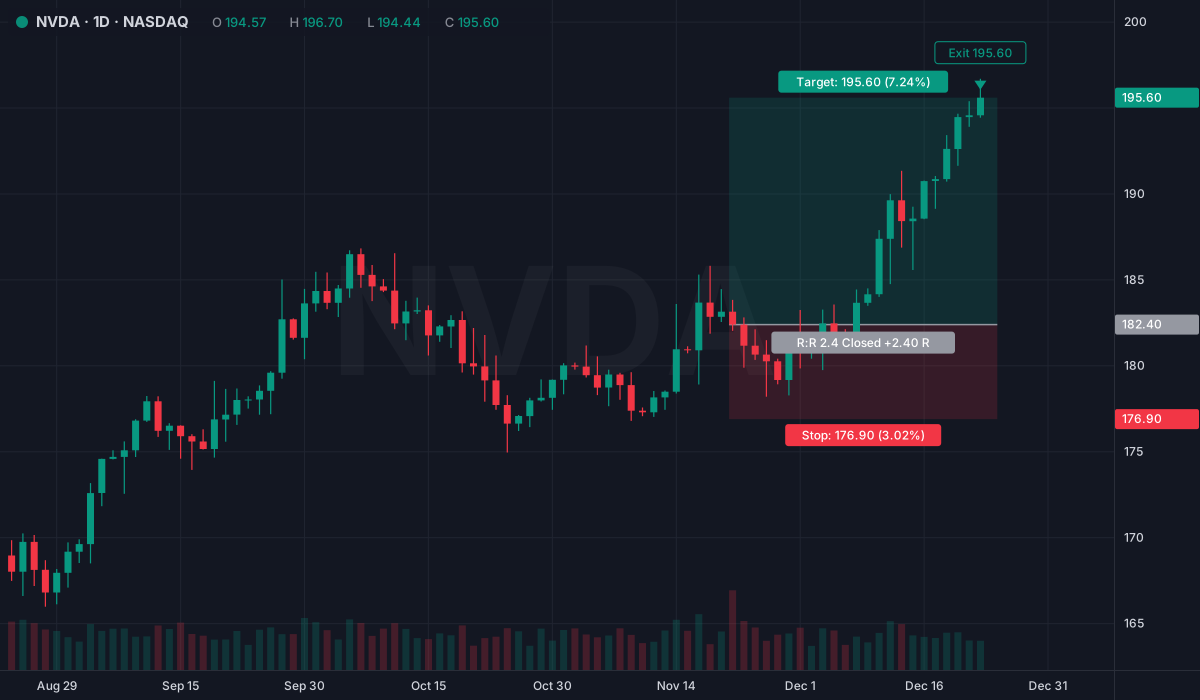
- Symbol
- NVDA, NASDAQ
- Timeframe
- Daily
- Direction
- Long
- Entry
- 182.40
- Stop
- 176.90
- Target
- 195.60
- R:R
- 2.4
- Setup
- Elliott wave 3
One picture is enough – for every adjustment, too
For the plan, for the stop you moved, for the result: you send the screenshot, the journal recognises what changed. Every value comes with a confidence; what is unclear stays empty instead of being guessed.
Setup
Symbol, timeframe, long or short, entry, stop, target, R:R and the name of the setup, mapped to your own list.
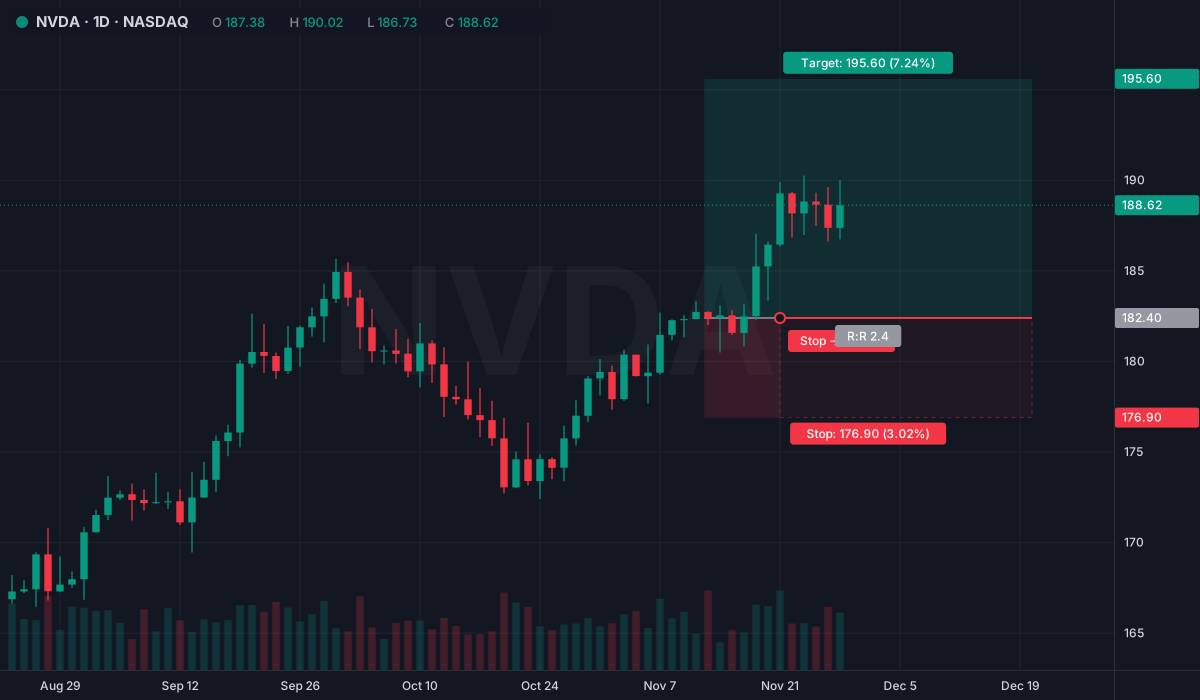
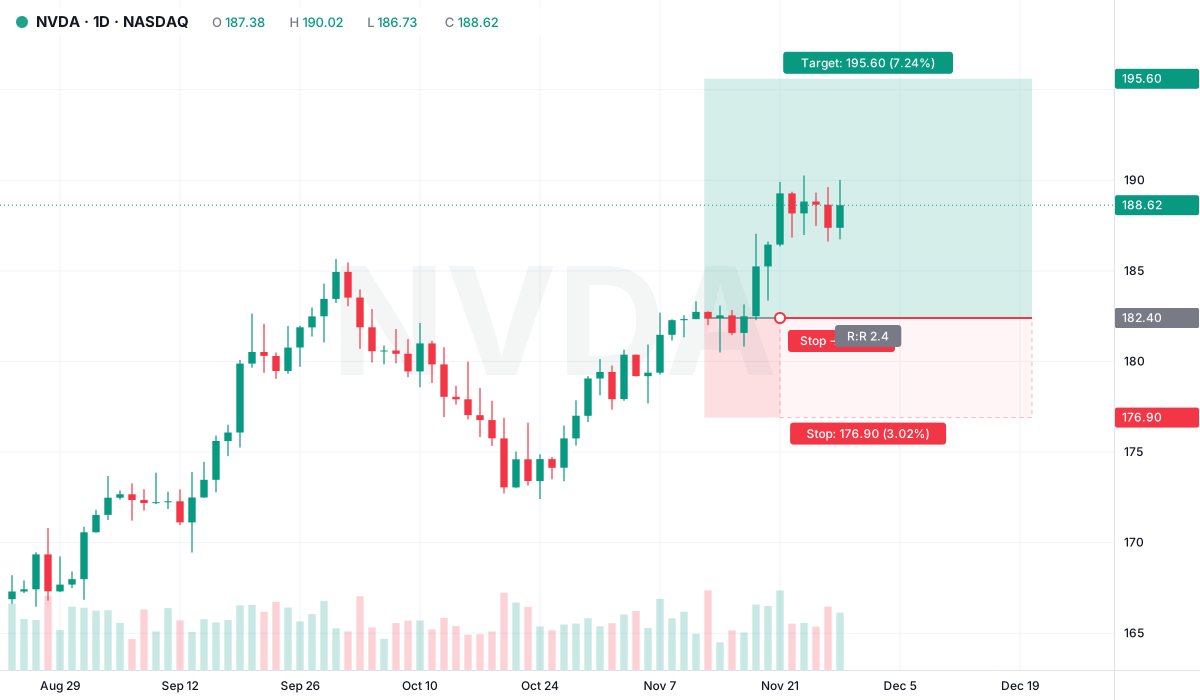
Stop adjustments
Stop moved to 182.40, i.e. breakeven: the journal compares with the current state and adds the change to the timeline.
Outcome
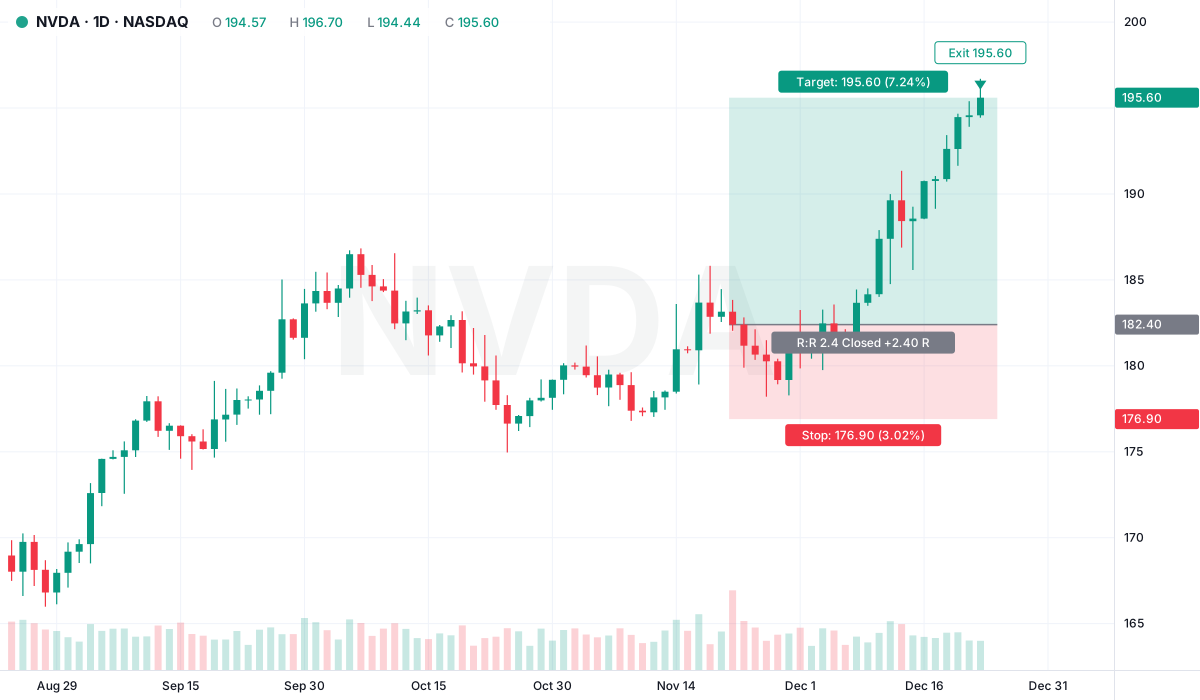
Target reached, exit 195.60, winner with +2.4 R. Stops, breakeven and partial closes alike.
Statistics in R, not just in percent
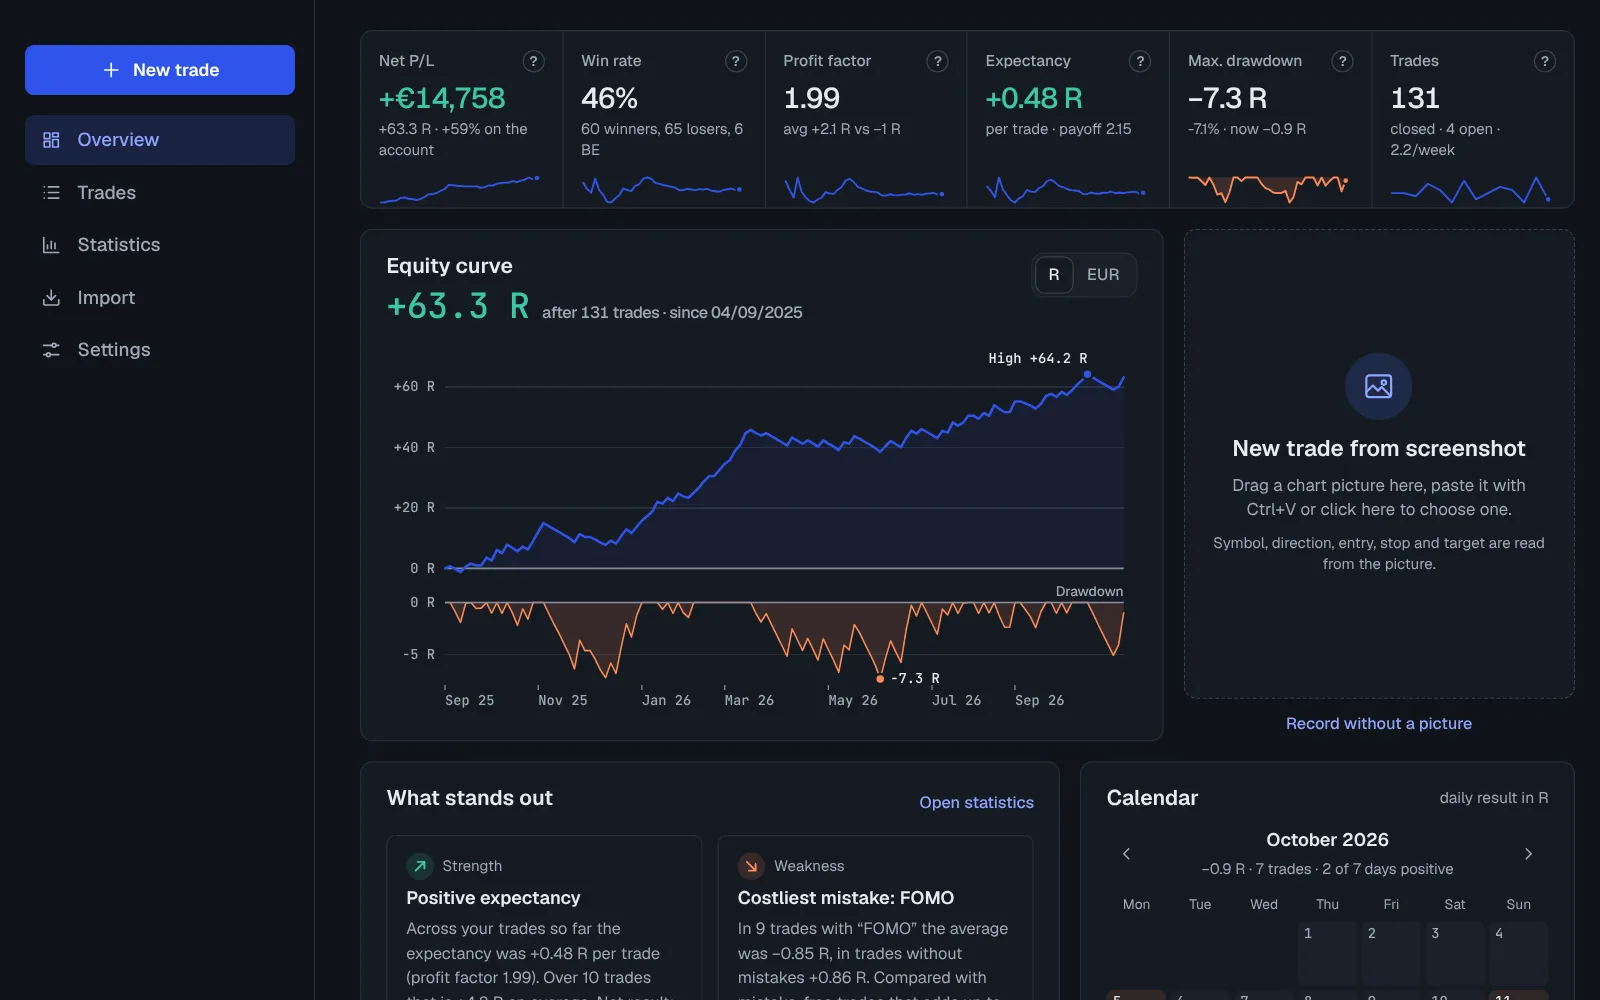
A high win rate alone says little. The journal measures every trade in R, the multiple of your risk, and shows where your edge lies and where it gets lost.
Expectancy in R
What a trade earns on average, measured against the risk taken. The number that decides everything.
Profit factor and drawdown
Gains against losses and the deepest fall of the equity curve, with the underwater band.
Setups compared
Which setup makes money and which only makes work, ranked by R per trade.
Weekday and time
A heatmap shows at which times your entries work and when you would better stay out.
Planned R:R against achieved R
Whether you let winners run or close them too early, at a glance.
Mistakes and their cost
FOMO, position too large, no stop: what each mistake has cost you in R.
After a win, after a loss
Whether you trade differently after two losses. The honest look at tilt.
The next 100 trades
Monte Carlo simulation from your own results: which range is realistic.
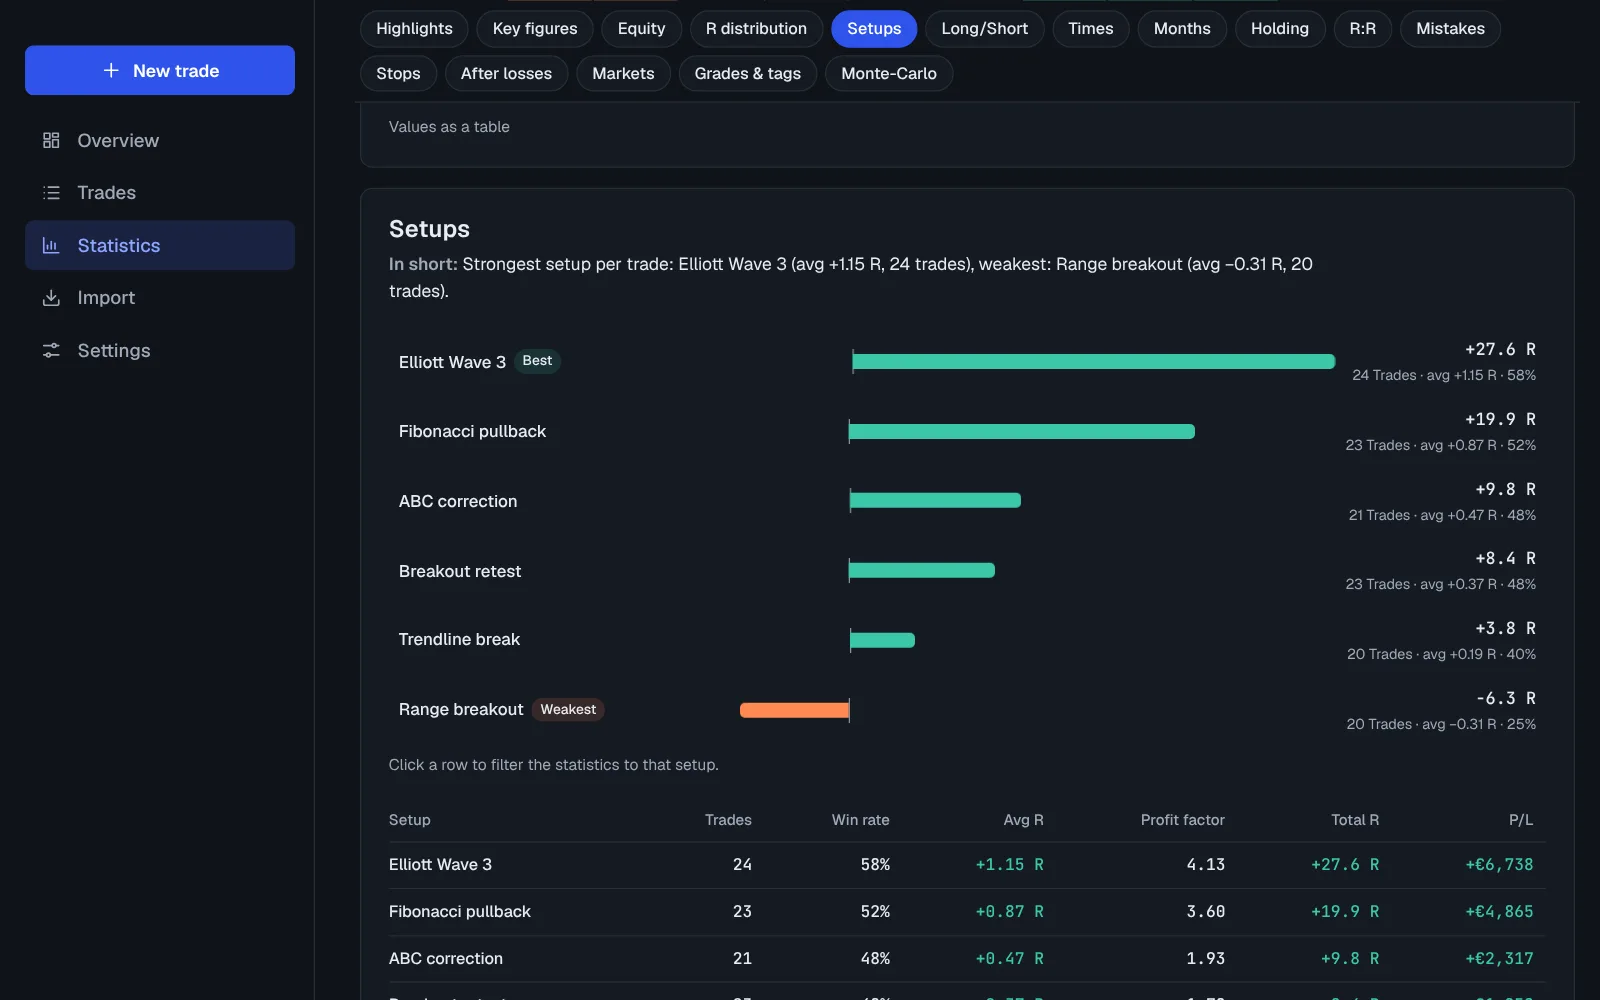
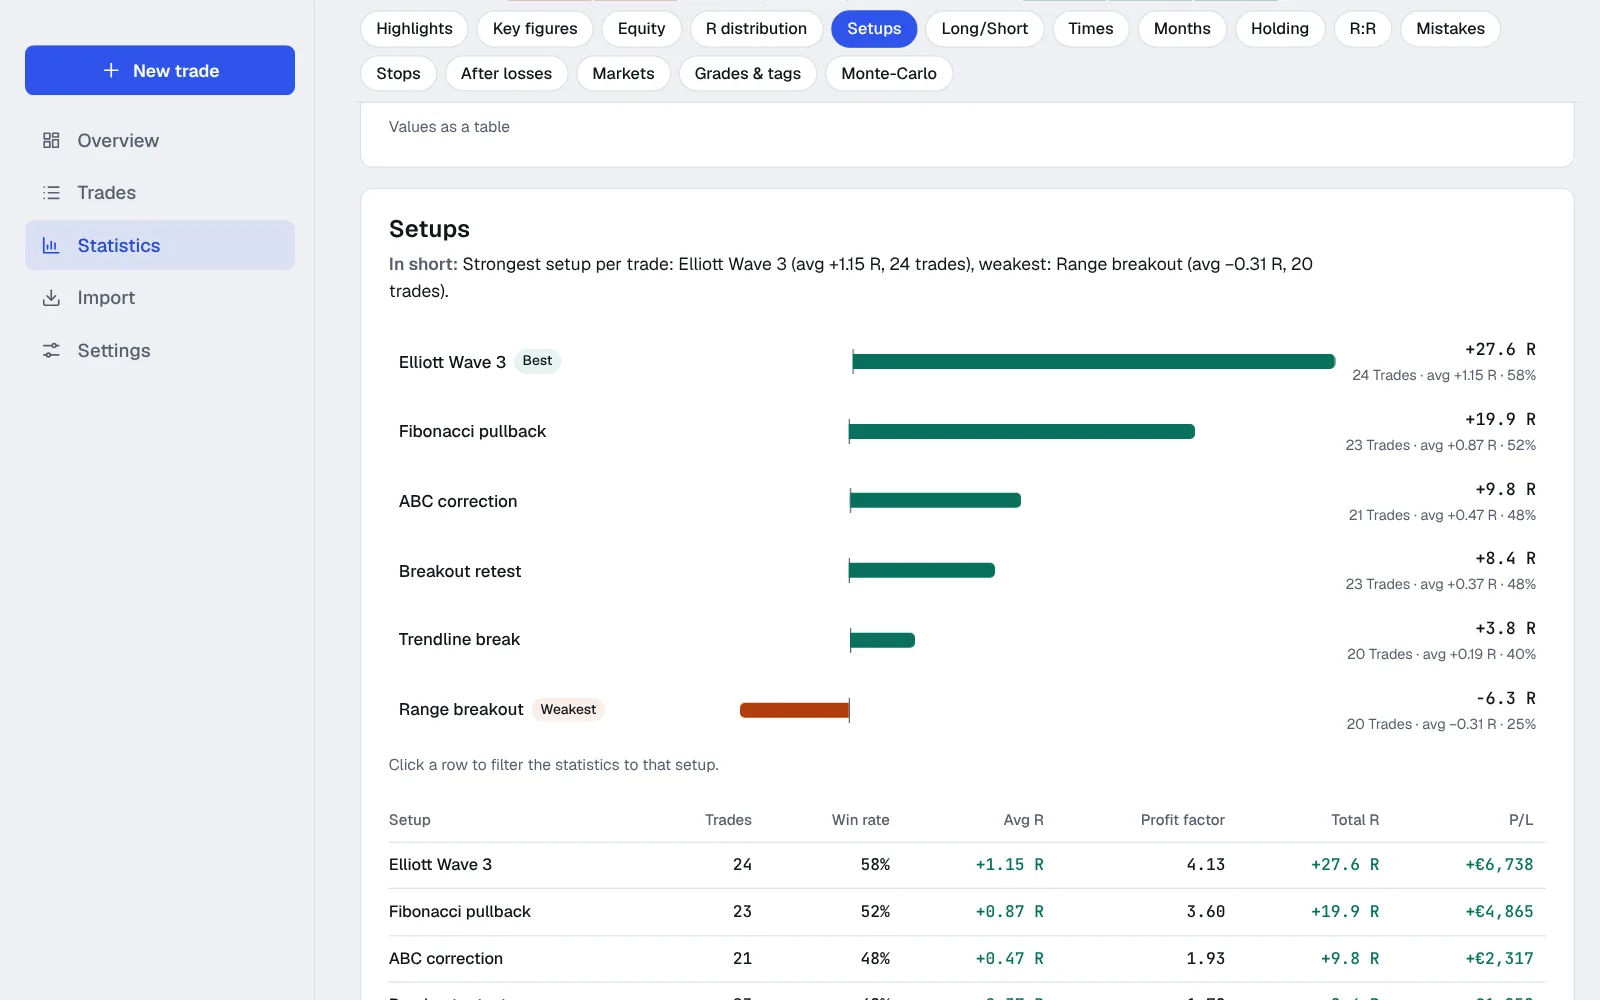
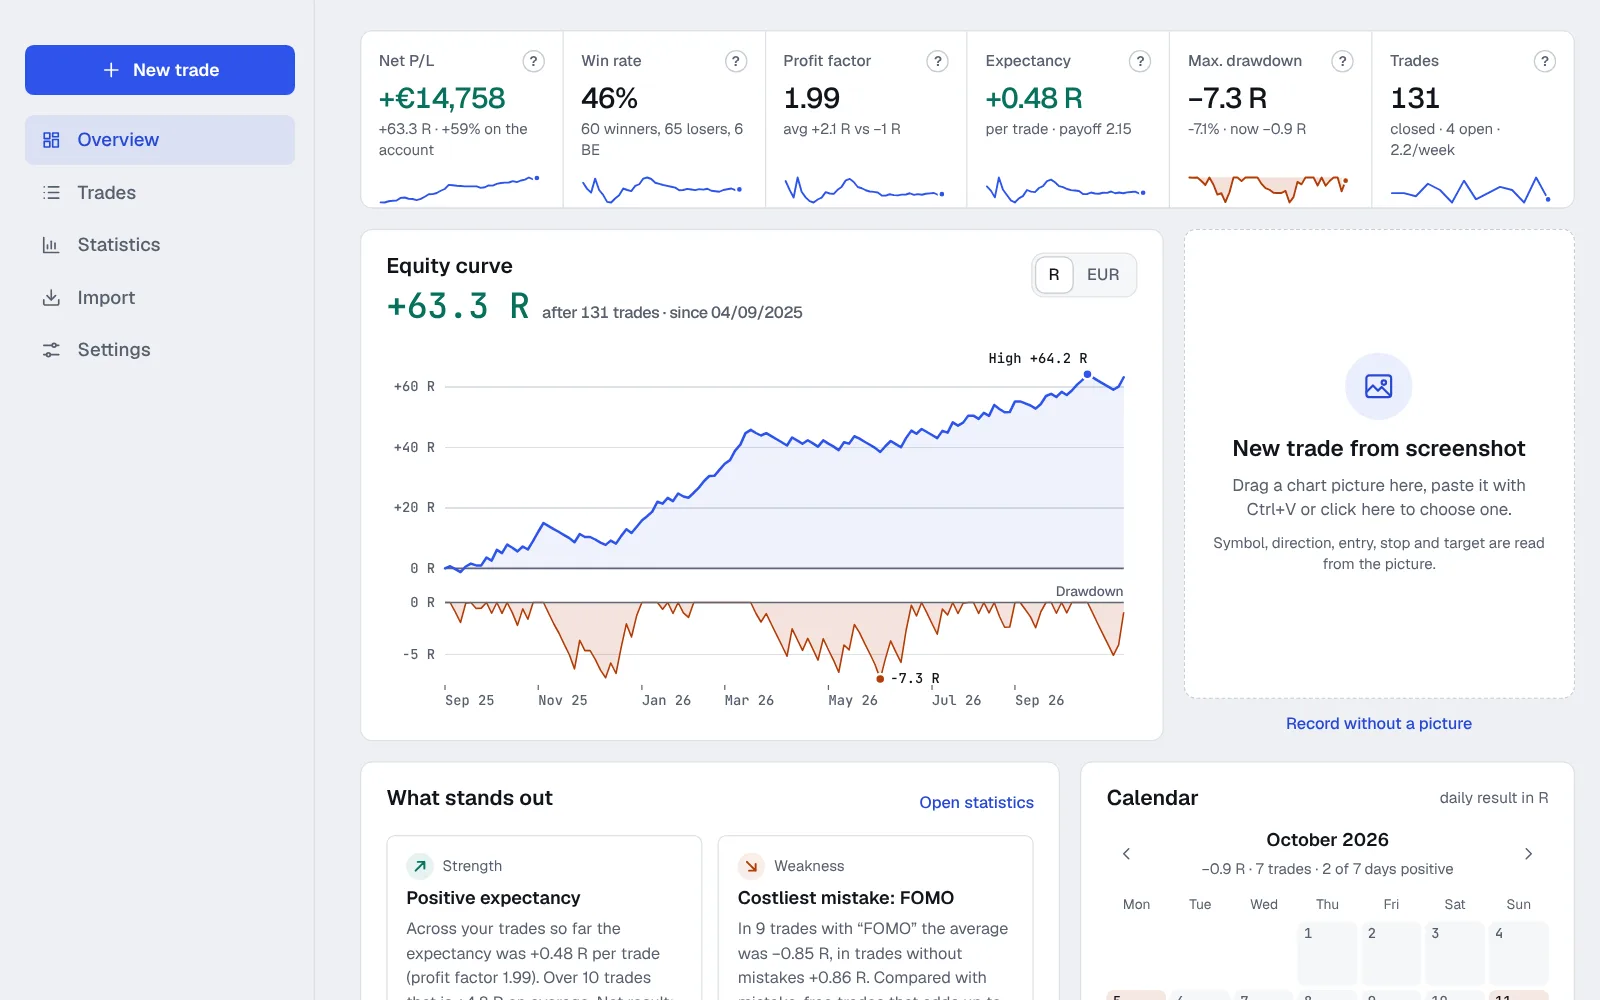
Pictures from the demo with invented example data. Statistics describe past trades and are not a forecast.
Bring your old trades
Many traders still keep their journal in PowerPoint or Excel. Both can be imported without retyping.
- .pptxPowerPoint
- Every slide becomes a trade. The recognition reads pictures and slide text, you review everything in one table and import what fits.
- .csvBrokers and Excel
- MetaTrader 4 and 5, TradingView, own spreadsheets: columns are mapped automatically, German and English number formats recognised.
- .jsonBackup
- The backup of your trades and settings, download and restore at any time (without the picture files).
Only you see your trades
A journal is honest when it is kept honestly. For that it must be clear where the data lives.
Only for your account
Trades, notes and pictures are bound to your account. Pictures are delivered only while you are signed in.
AI only when you ask
A picture only goes to the recognition when you start it. No training of AI models with your data.
No tracking
No advertising, no analytics, one single cookie for signing in. Runs on Cloudflare's infrastructure.
Take it with you, delete it
Export as CSV or JSON at any time. Deleting the account means every trade and picture is gone.
Free during the launch phase
Every account now gets every feature with the launch limits, without payment details. Later there will be a free plan and Pro; you will hear about it by e-mail at least four weeks in advance.
| Feature | Launch phase (now) | Free | Pro |
|---|---|---|---|
| Price | free | 0 € | price to follow |
| Trades | 10,000 | 50 | 10,000 |
| Pictures | 8,000 | 150 | 8,000 |
| Storage for pictures | 5 GB | 300 MB | 5 GB |
| AI picture analyses per day | 60 | 5 | 60 |
| AI picture analyses per month | 100 | 20 | 500 |
| Statistics, import, export | all | all | all |
Frequently asked questions
Which charts does the journal recognise?
Best are TradingView screenshots with the long or short position tool. MetaTrader, broker apps and photos of the screen work too; the clearer the legend, price axis and position box, the more values are recognised.
How accurate is the recognition?
Every recognised value shows how certain the recognition is. What cannot be read clearly stays empty instead of being guessed. You check everything before taking it over and can change any value.
How do I record a stop I moved?
With a new screenshot: “Update from screenshot” in the trade compares the picture with the current state and suggests the change, such as “stop moved to entry” or a partial close.
Do I need a connection to my broker?
No. The journal connects to no broker account and never asks for login details. Trades come from pictures, by hand or from your broker's CSV export.
Who can see my screenshots?
Only you. Pictures are only delivered to your signed-in account. They go to the AI service for recognition only when you start the analysis; they are not used to train AI models.
Is this investment advice?
No. The journal documents and evaluates your own past trades. It gives no recommendations to buy or sell.
What does the Trading Journal cost?
Nothing during the launch phase: every feature, up to 10,000 trades and 100 picture analyses a month. Before paid plans start, you will hear about it by e-mail at least four weeks in advance.
Can I take my data with me?
At any time: as CSV for Excel or as a JSON backup of all trades and settings (the pictures listed with their address, downloadable one by one while signed in). Deleting the account deletes all trades and pictures.
Does it work on the phone?
Yes. Take a screenshot in your broker app, upload it in the browser, done. The statistics adapt to small screens.
Start with your last trade.
One screenshot is enough. Two minutes later it is in your journal, with every value.